
Reading the Grid: a Map of Human Behaviour
If you’re at all familiar with your hoozyu report, you’ll know that there are a couple of different kinds of data that you receive upon completion of the questionnaire.
These include:
- Your Grid
- Your Interests
- Your Focus
The latter two of these are fairly straightforward, but the Grid has a bit more to it than immediately meets the eye… So, if you’ve looked at your own Grid in the past, and not really understood what it was telling you, the following information is here to help!
Firstly: we call the Grid a ‘Map of Normal Human Behaviour’.
If we were able to gather hoozyu data for every person in the world, we would expect to see a pretty even spread for each of the markers, right across the Grid.
What that means is that wherever your markers appear - whether they are grouped close together, far apart, across multiple colours, or all in one corner - wherever they appear: you are completely normal.
There are no good or bad Grids, and no good or bad reports! There is no combination of scores that we could look at and say “well this one’s a weirdo!”
So whatever you see when you look at your Grid, don’t worry about what it might be saying - it is simply giving you a picture of where you fall within the population as a whole.
What do I mean by that?
Well, following the indication that the world’s population is spread evenly across the Grid, you could look at your own Grid and say - for example, if your Diamond (Usual) marker was in the Red quadrant - “the majority of people are less Red in their Usual Behaviour than me, and therefore likely to be less involved in practical, hands-on activity than I am”.
(If you think about it, an even spread would mean roughly 25% of the population would fall within each colour, and so - whichever quadrant your symbol is in - you are part of the ~25% who are more ‘that colour’ than the other ~75% of the population…)
Does that make sense to you?
What I’m getting at here is that understanding who you are, can help you understand what many of the people around you are not.
You’ll always be able to find people who are somewhat similar to you, but recognising that the majority of people you meet may be significantly different, is really important to understanding the unique value we can each bring to different situations.
So, the Grid helps us to understand our place within the overall population, and gives us a visual illustration of the fact that there will always be people who are either more, or less, ____ than us… but what do the symbols actually mean?
Your Grid maps 4 specific pieces of information.
The Asterisk is a summary of Your Interests (you can read more about this here).
The Diamond represents your Usual Behaviour.
The Circle marks your Underlying Need, and it is always in the same position as your Square which represents your Stress Behaviour.
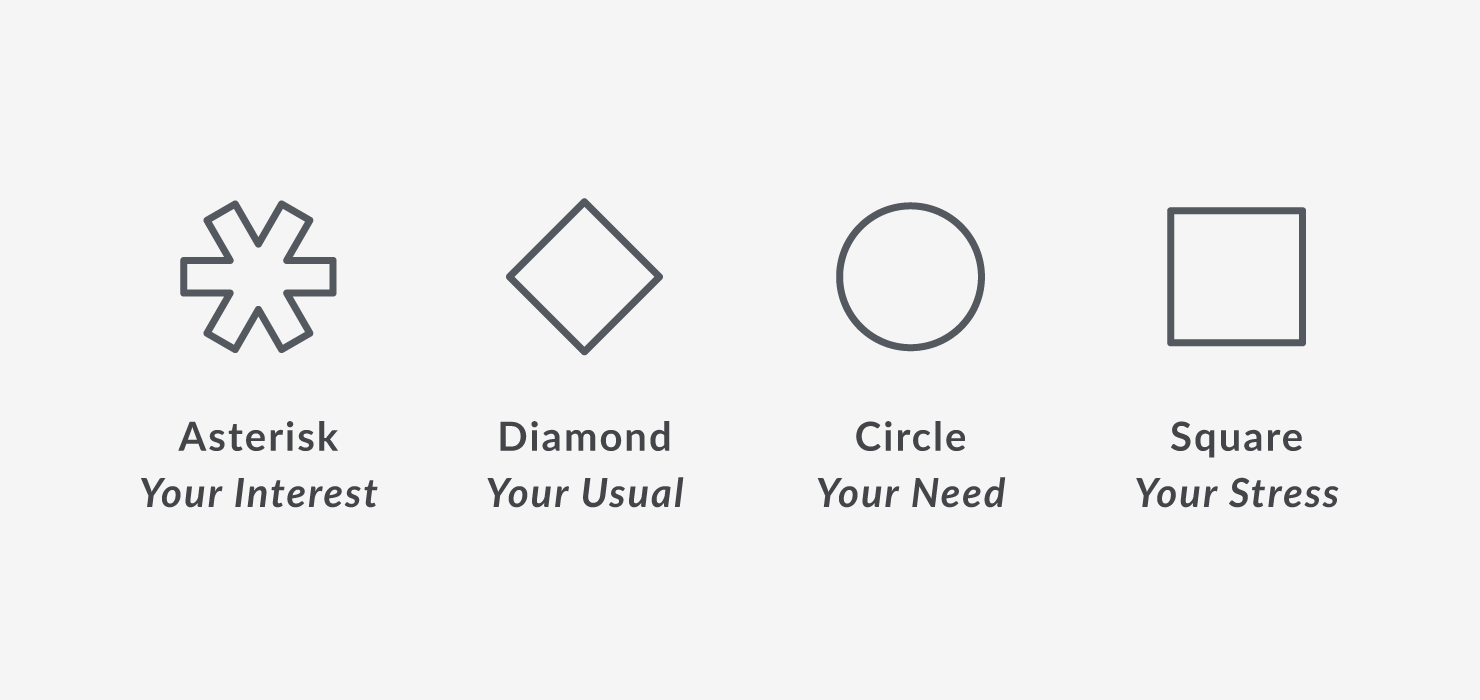
So, the Grid shows us our Interest, Usual, Need and Stress.
Or, let’s say that another way: the Grid maps our Motivation & Perspective. Our Interest score makes up the motivation aspect, and the other 3 scores (Usual, Need, Stress) give us insight into our perspective.
Here’s a simple diagram to help you understand the relationship between those 3 perspective scores.
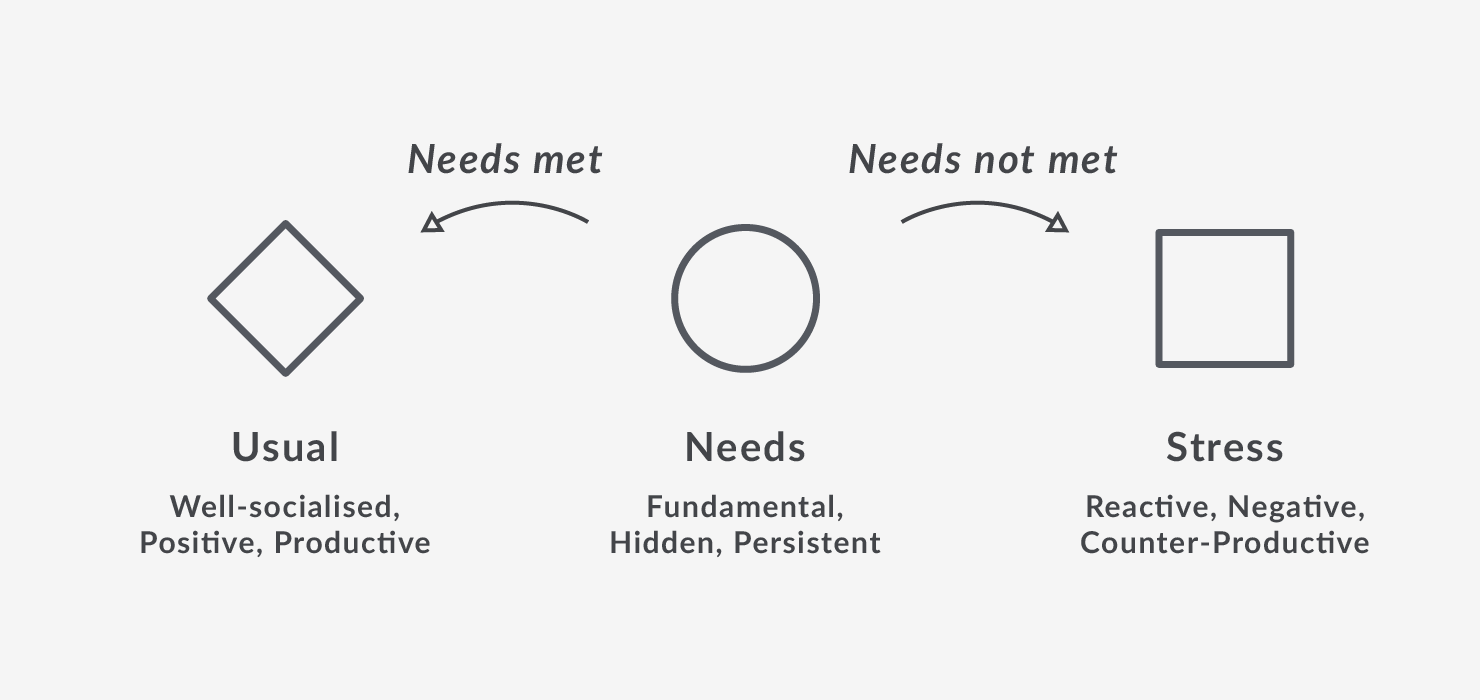
Our Underlying Need is at the root of everything. It is our most fundamental score and the thing we are least able to change.
It also has the greatest potential to develop into a strength - but all too often a lack of awareness of our fundamental needs can lead us into trouble.
Need met enables positive, productive, Usual Behaviour. Need not met delivers negative, counter-productive, Stress Behaviour.
Knowing what your Need is makes it a whole lot easier to make sure it’s being met - and recognising those positive and negative reactions in yourself is a great help too!
So now we understand the value of the Grid, and the vital scores it’s mapping - but how do we read the Grid itself?
What do the colours mean? What does each axis represent? Are the quadrants just boxes that we’re dumped into? Or does the exact positioning of each marker tell us something important?
Find out in the next post in our Reading the Grid series: Understanding the Grid Dimensions!